Previous
Ensemble Learning
Contents
Table of Contents
Next
Gaussian Mixture Model

Chapter 11

Clustering

11.1. Overview

This chapter introduces a major unsupervised learning topic: clustering. To ensure a good transition from supervised learning to unsupervised learning, we will first try to fill some possible knowledge gaps through a review of the basics of unsupervised learning. This includes changes from supervised to unsupervised learning, a framework of unsupervised learning, and an overview of clustering algorithms. Based on them, details will be provided for K-Means, DBScan, GMM, and Agglomerative Hierarchical as the most representative algorithms for four main categories of clustering algorithms: centroid-based, density-based, distribution-based, and connectivity-based, respectively. Finally, the evaluation of clustering, including popular metrics and their use, will be discussed.

11.2. Basics of Unsupervised Learning

11.2.1. From Supervised Learning to Unsupervised Learning

So far, we have been discussing machine learning mostly in the context of supervised learning. This means we primarily focus on datasets consisting of input X ¯ X ¯ bar(X)\bar{X}X¯ and output y y vec(y)\vec{y}y, and accordingly, the goal of such a machine learning algorithm is to learn how to predict y y vec(y)\vec{y}y based on X ¯ X ¯ bar(X)\bar{X}X¯. It is true that supervised learning traditionally predominates data science applications. However, other machine learning categories like unsupervised learning [115, 116] have been attracting more and more attention due to the explosive growth of data, in which labeled data is more frequently a small or even a rare slice.
Starting from this chapter, we will explore unsupervised learning. Such machine learning algorithms do not process data with input-output pairs, but instead, only the inputs X ¯ X ¯ bar(X)\bar{X}X¯ or unlabeled samples. This fact would raise an obvious question: what do we need to predict if a label is not given as the output? In fact, the goal of unsupervised learning is not to find relationships between the unlabeled samples and labels as the two distinct parts of the data, but instead, to find relationships between different parts within the data. In other words, we need to discover some types of structures in the data. Different unsupervised learning algorithms work differently and discover very different kinds of structures.
In the following subsections, we will first work on the framework and classification of unsupervised learning. After outlining unsupervised learning in a generic manner, specific algorithms for one major type of unsupervised learning, i.e., clustering, will be introduced. Then, in the following chapters, we will use more unsupervised learning algorithms, i.e., dimension reduction and anomaly detection, to see how such algorithms fit into this framework.

11.2.2. Framework for Unsupervised Learning

The supervised learning algorithms introduced before have exhibited several key components: 1) a hypothesis (function), 2) a loss function, and 3) a method for minimizing the average loss function over the training data. Some of these components may change as we move to unsupervised learning. For example, how do we define a hypothesis function when there are no labels to predict? Likewise, how can we define a loss function when there are no true or predicted labels?
The hypothesis function in the unsupervised learning is defined as a mapping from input R n R n R^(n)\mathbb{R}^{n}Rn back into this input space: h θ : R n R n h θ : R n R n h_(theta):R^(n)rarrR^(n)h_{\theta}: \mathbb{R}^{n} \rightarrow \mathbb{R}^{n}hθ:RnRn. Thus, the goal of this hypothesis is to approximately reconstruct the input, i.e., x i h θ ( x i ) x i h θ x i vec(x)_(i)~~h_(theta)( vec(x)_(i))\vec{x}_{i} \approx h_{\theta}\left(\vec{x}_{i}\right)xihθ(xi) (or written as X ¯ h θ ( X ¯ ) X ¯ h θ ( X ¯ ) bar(X)~~h_(theta)( bar(X))\bar{X} \approx h_{\theta}(\bar{X})X¯hθ(X¯) for all the data), just like y i f θ ( x i ) y i f θ x i y_(i)~~f_(theta)( vec(x)_(i))y_{i} \approx f_{\theta}\left(\vec{x}_{i}\right)yifθ(xi) in supervised learning. Under this condition, you may wonder why we
would not propose an "easy" function x i = x i x i = x i vec(x)_(i)= vec(x)_(i)\vec{x}_{i}=\vec{x}_{i}xi=xi, which 'reconstructs' the input perfectly yet makes little sense. The reason is that we need to additionally restrict our class of hypothesis functions or limit the hypothesis space so that the mapping h θ ( x i ) h θ x i h_(theta)( vec(x)_(i))h_{\theta}\left(\vec{x}_{i}\right)hθ(xi) is not a direct copy of x i x i vec(x)_(i)\vec{x}_{i}xi but a mapping that can help recover the data structure in a preferred way.
The loss function is always essential in unsupervised learning to specify the direction for the search for the best model. As indicated above, unsupervised learning needs to minimize the difference between the (output of) hypothesis function and the input itself. Accordingly, the loss function needs to present a quantitative way to measure this difference. That is, the loss function : R n × R n R + : R n × R n R + ℓ:R^(n)xxR^(n)rarrR_(+)\ell: \mathbb{R}^{n} \times \mathbb{R}^{n} \rightarrow \mathbb{R}_{+}:Rn×RnR+is a measure of the difference between the predicted input with desired data structures and the original input. A common loss function is the least square function. Taking the i i iii th sample as an example, we have its loss as
(11.1) ( h θ ( x i ) , x i ) = h θ ( x i ) x i 2 . (11.1) h θ x i , x i = h θ x i x i 2 . {:(11.1)ℓ(h_(theta)( vec(x)_(i)), vec(x)_(i))=||h_(theta)( vec(x)_(i))- vec(x)_(i)||_(2).:}\begin{equation*} \ell\left(h_{\theta}\left(\vec{x}_{i}\right), \vec{x}_{i}\right)=\left\|h_{\theta}\left(\vec{x}_{i}\right)-\vec{x}_{i}\right\|_{2} . \tag{11.1} \end{equation*}(11.1)(hθ(xi),xi)=hθ(xi)xi2.
Optimization as the process to minimize the above loss function is also essential in unsupervised learning. However, distinct from supervised learning, which employs methods like gradient descent to solve this optimization problem, the optimization in unsupervised learning may be more diverse. This is because the hypothesis functions in unsupervised learning often involve discrete or other terms that cannot be differentiated. This can be seen in algorithms like K-Means for clustering. Moreover, the optimization method in some algorithms like the PCA for dimension reduction can provide an exact solution. Thus, the optimization may appear to be more of a "core" part in some unsupervised learning algorithms.
(11.2) min θ 1 I i = 1 I ( h θ ( x i ) , x i ) (11.2) min θ 1 I i = 1 I h θ x i , x i {:(11.2)min_(theta)(1)/(I)sum_(i=1)^(I)ℓ(h_(theta)( vec(x)_(i)), vec(x)_(i)):}\begin{equation*} \min _{\theta} \frac{1}{I} \sum_{i=1}^{I} \ell\left(h_{\theta}\left(\vec{x}_{i}\right), \vec{x}_{i}\right) \tag{11.2} \end{equation*}(11.2)minθ1Ii=1I(hθ(xi),xi)

11.2.3. Overview of Clustering

Clustering refers to a sub-category of unsupervised learning tasks, and the corresponding algorithms aim to find groupings in unlabeled data. These groupings are also frequently called "clusters". Every cluster is composed of a group of data points that are similar to each other. Thus, the data structures in clustering refer to the groupings of data points based on their similarities or connections. In the context of clustering, clustering sometimes refers to the result or process of a clustering task, or called a cluster partition in some literature, while a cluster refers to a group of points in a clustering. Please be aware of the difference.
The way of performing a clustering task, e.g., selecting a suitable algorithm, is sometimes highly related to or even dependent on the nature of the data. On one hand, the selection of clustering algorithms requires knowledge about data. Meanwhile, we are usually expected to use clustering as a way of understanding the data. This leads to a "chicken or egg" paradox. In some cases, we may even know little about the data when selecting the algorithm.
Clustering algorithms can be classified based on how to find or assess the relationships between different data points. The following four common types of clustering models have been widely adopted [117].

Centroid-Based Clustering

In centroid-based clustering (or called centroid models in some literature), clusters are identified according to the proximity of the data points to the cluster centers or centroids. The centroid is searched to ensure that the data points are closest to the center. Data points are differentiated or clustered based on their relationships with multiple centroids in the data. K-Means clustering and Mean-Shift blustering are the most popular algorithms in this category.

Density-Based Clustering

Density-based clustering algorithms search for areas with varying densities of data points in the data space. Those areas with a high concentration (or density) of data points surrounded by areas with low concentrations of data points are identified as groups. The clusters can be of any shape. DBScan and OPTICS are two of the most popular density-based clustering algorithms.

Distribution-Based Clustering

Distribution-based clustering groups data together based on the probabilities of how different data points belong to the same distribution. Usually, a distribution is assumed beforehand. Then, a center point is determined for each cluster. Next, the probability of a data point belonging to a cluster is determined by its distance to the cluster center point. This probability usually decreases as the distance to the center increases. Gaussian Mixture Theory (GMM) is the most com-
mon algorithm in this category.

Hierarchical (Connectivity) Clustering

Hierarchical, or connectivity-based clustering, usually involves top-bottom or bottom-up hierarchies to form clusters. This category of algorithms is suitable for hierarchical data and, due to the same reason, is more restrictive than the others. Despite the limitations, such algorithms may be also more efficient for specific kinds of data clusters. Agglomerative Hierarchical Algorithm is the most popular algorithm in this category.
In the following, we will provide details for K-Means, DBScan, GMM, and Agglomerative Hierarchical as the most representative algorithms from the above four categories. In particular, more detail will be shared for K-Means, which is a great example to illustrate the idea, process, and implementation of clustering, and for GMM, which is more mathintensive and difficult to understand compared with other clustering algorithms.

11.3. K-Means Clustering

K-Means algorithm aims to find K K KKK "centroids" (geometric centers), "centers", or "means" (that is, μ i R n μ i R n mu_(i)inR^(n)\mu_{i} \in \mathbb{R}^{n}μiRn ) for K K KKK clusters of points, so that the data points in each cluster are close to the corresponding center [118]. In this way, we can also associate every point with a specific (in fact, the closest) center, and this center can also serve as an indication of which cluster the point belongs to.
The implementation of K-Means will involve an iterative process. This is because the centers that we specify at the beginning are not necessarily the "optimal" or "true" centers. Thus, after we cluster all the points according to these centers, we can calculate the new centers based on the clustered points, which may be different from the original ones. In this way, the locations of the centers can be updated. This process can be repeated until a criterion is met: further updates will not change the clustering.
In the following subsections, we will present a formal math description of K-Means. Then, the implementation of this algorithm for a simple clustering task is given to illustrate the above-mentioned iterative process. Next, two typical issues for K-Means, i.e., the initialization of the centroids and the determination of the hyperparameters K K KKK are discussed.

11.3.1. Math Framework of K-Means Algorithm

K-Means is defined with a hypothesis function parameterized by μ ¯ μ ¯ bar(mu)\bar{\mu}μ¯, which are constructed with the coordinates of the centers.
(11.3) μ ¯ = { μ 1 , , μ k , , μ k } (11.3) μ ¯ = μ 1 , , μ k , , μ k {:(11.3) bar(mu)={ vec(mu)_(1),cdots, vec(mu)_(k),cdots, vec(mu)_(k)}:}\begin{equation*} \bar{\mu}=\left\{\vec{\mu}_{1}, \cdots, \vec{\mu}_{k}, \cdots, \vec{\mu}_{k}\right\} \tag{11.3} \end{equation*}(11.3)μ¯={μ1,,μk,,μk}
where μ k R n μ k R n vec(mu)_(k)inR^(n)\vec{\mu}_{k} \in \mathbb{R}^{n}μkRn is the vector of the coordinates of the k k kkk th center.
The hypothesis function, h μ ¯ ( x ) h μ ¯ ( x ) h_( bar(mu))( vec(x))h_{\bar{\mu}}(\vec{x})hμ¯(x), outputs the center that is the closest to the point x x vec(x)\vec{x}x. This can be mathematically formulated as
(11.4) h μ ¯ ( x ) = arg min μ ¯ { μ ( 1 ) , , μ ( k ) } μ x 2 (11.4) h μ ¯ ( x ) = arg min μ ¯ μ ( 1 ) , , μ ( k ) μ x 2 {:(11.4)h_( bar(mu))( vec(x))=arg min_( bar(mu)in{ vec(mu)^((1)),cdots, vec(mu)^((k))})|| vec(mu)- vec(x)||_(2):}\begin{equation*} h_{\bar{\mu}}(\vec{x})=\arg \min _{\bar{\mu} \in\left\{\vec{\mu}^{(1)}, \cdots, \vec{\mu}^{(k)}\right\}}\|\vec{\mu}-\vec{x}\|_{2} \tag{11.4} \end{equation*}(11.4)hμ¯(x)=argminμ¯{μ(1),,μ(k)}μx2
where the arg min operator returns the argument that minimizes the expression (as opposed to the min operator, which just returns the minimum value). That is, the expression outputs which center out of { μ 1 , , μ k } μ 1 , , μ k { vec(mu)_(1),dots, vec(mu)_(k)}\left\{\vec{\mu}_{1}, \ldots, \vec{\mu}_{k}\right\}{μ1,,μk} is closest to the sample represented by x x vec(x)\vec{x}x.
Then for any point x x vec(x)\vec{x}x, the associated loss is the square of the distance between this point and the nearest center obtained using h μ ¯ ( x ) h μ ¯ ( x ) h_( bar(mu))( vec(x))h_{\bar{\mu}}(\vec{x})hμ¯(x) :
(11.5) ( h μ ¯ ( x ) , x ) = h μ ¯ ( x ) x 2 . (11.5) h μ ¯ ( x ) , x = h μ ¯ ( x ) x 2 . {:(11.5)ℓ(h_( bar(mu))(( vec(x))),( vec(x)))=||h_( bar(mu))(( vec(x)))-( vec(x))||_(2).:}\begin{equation*} \ell\left(h_{\bar{\mu}}(\vec{x}), \vec{x}\right)=\left\|h_{\bar{\mu}}(\vec{x})-\vec{x}\right\|_{2} . \tag{11.5} \end{equation*}(11.5)(hμ¯(x),x)=hμ¯(x)x2.
The above function is equivalent to the following formulation because this loss between a point and the nearest center is equal to the minimum of the losses between this point and all the centers:
(11.6) ( h μ ¯ ( x ) , x ) = min μ { μ 1 , , μ k } μ x 2 . (11.6) h μ ¯ ( x ) , x = min μ μ 1 , , μ k μ x 2 . {:(11.6)ℓ(h_( bar(mu))(( vec(x))),( vec(x)))=min_( vec(mu)in{ vec(mu)_(1),cdots, vec(mu)_(k)})|| vec(mu)- vec(x)||_(2).:}\begin{equation*} \ell\left(h_{\bar{\mu}}(\vec{x}), \vec{x}\right)=\min _{\vec{\mu} \in\left\{\vec{\mu}_{1}, \cdots, \vec{\mu}_{k}\right\}}\|\vec{\mu}-\vec{x}\|_{2} . \tag{11.6} \end{equation*}(11.6)(hμ¯(x),x)=minμ{μ1,,μk}μx2.
Finally, clustering using K-Means can be formulated as an optimization problem as Eq. 11.7:
(11.7) min θ 1 I i = 1 I min μ ¯ { μ 1 , , μ k } μ x i 2 . (11.7) min θ 1 I i = 1 I min μ ¯ μ 1 , , μ k μ x i 2 . {:(11.7)min_(theta)(1)/(I)sum_(i=1)^(I)min_( bar(mu)in{ vec(mu)_(1),cdots, vec(mu)_(k)})||( vec(mu))- vec(x)_(i)||_(2).:}\begin{equation*} \min _{\theta} \frac{1}{I} \sum_{i=1}^{I} \min _{\bar{\mu} \in\left\{\vec{\mu}_{1}, \cdots, \vec{\mu}_{k}\right\}}\left\|\vec{\mu}-\vec{x}_{i}\right\|_{2} . \tag{11.7} \end{equation*}(11.7)minθ1Ii=1Iminμ¯{μ1,,μk}μxi2.
As introduced, the solution to the above optimization problem involves an iterative process. The iterative process is implemented by assigning each point to its closest center and then updating each center to be the mean of these assigned points. This iterative process specific to K-Means, as the standard method for training K-Means models, is sometimes called Lloyd's algorithm or simply referred to as 'K-Means'. Note that Lloyd's algorithm is an instance of the general Expectation-Maximization (or E-M) method for optimization, which is used by many machine learning algorithms. Besides, K-Means, in a broad sense, can also be implemented using other methods, which will not introduced here for simplicity.
There are many ways to initially assign cluster centers, but a common strategy is simply to choose k k kkk of the data points at random. Formally, the algorithm works as follows.

K-Means:

Input: Dataset x i , i = 1 , , I x i , i = 1 , , I vec(x)_(i),i=1,cdots,I\vec{x}_{i}, i=1, \cdots, Ixi,i=1,,I
Initialize: μ k = RandomChoice ( x ( 1 : I ) ) , k = 1 , , K μ k = RandomChoice x ( 1 : I ) , k = 1 , , K mu_(k)=RandomChoice( vec(x)_((1:I))),k=1,cdots,K\mu_{k}=\operatorname{RandomChoice}\left(\vec{x}_{(1: I)}\right), k=1, \cdots, Kμk=RandomChoice(x(1:I)),k=1,,K
Repeat until convergence:
Assign point clusters: y i = arg min k μ k x i 2 2 y i = arg min k μ k x i 2 2 y_(i)=arg min_(k)|| vec(mu)_(k)- vec(x)_(i)||_(2)^(2)y_{i}=\arg \min _{k}\left\|\vec{\mu}_{k}-\vec{x}_{i}\right\|_{2}^{2}yi=argminkμkxi22
Compute new centers: μ k = i = 1 I x i 1 { y i = k } i = 1 I 1 { y i = k } μ k = i = 1 I x i 1 y i = k i = 1 I 1 y i = k vec(mu)_(k)=(sum_(i=1)^(I) vec(x)_(i)*1{y_(i)=k})/(sum_(i=1)^(I)1{y_(i)=k})\vec{\mu}_{k}=\frac{\sum_{i=1}^{I} \vec{x}_{i} \cdot 1\left\{y_{i}=k\right\}}{\sum_{i=1}^{I} 1\left\{y_{i}=k\right\}}μk=i=1Ixi1{yi=k}i=1I1{yi=k}.
where 1 is the indicator function, for which 1 { y i = k } 1 y i = k 1{y_(i)=k}1\left\{y_{i}=k\right\}1{yi=k} yields 1 and 1 { y i k } 1 y i k 1{y_(i)!=k}1\left\{y_{i} \neq k\right\}1{yik} yields 0 .
It can be proven that the above iterative process can guarantee that the loss function is gradually decreased. Moreover, because there are only a finite number of possible clusterings, the algorithm will converge after a finite number of steps. This process ends when we observe that the clusters stay unchanged from one iteration to the next.

11.3.2. Implementation of K-Means

In this subsection, we use a very simple clustering problem with three possible clusters of points to demonstrate the implementation of K-Means. Let us first prepare the data. The three clusters of points were generated using normal distributions with three different centers.
# Prepare 3 clusters of data
              I, J = (1000,2) # 1000 points, 2 attributes
              np.random.seed (9527)
              X = np.random.randn (I, J)
              Mu0 = np.array([[0,-4], [-4,4], [2,2]]) # Centers of the 3 clusters
              X += Mu0[np.random.choice(np.arange(3), I),:] # Assign points to the 3 clusters
              # plt.scatter(X[:,0], X[:,1]) # Plot original data
              
The following code gives out the implementation of the iterative optimization process and plots a screenshot for each step.
K = Mu0.shape[0] # Define the number of clusters to generate (e.g., 3)
              max_iter = 4 # Number of KNN iterations
              colors = np.array(["C0", "C1", "C2"])
              f,ax = plt.subplots(max_iter) # figsize=(6.0, 4.6*max_iter)
              Mu = X[np.random.choice(X.shape[0],K),:]
              for n in range(max_iter):
                D = np.empty((X.shape[0],K)) # 1000 points, each has 3 distances to 3 centers
                for i in range(K): # Loop over all the centers (3 centers)
                        D[:,i] = np.sum((X-Mu[i])**2,axis=1)
                y = np.argmin(D,axis=1)
                ax[n].scatter(X[:,0], X[:,1], edgecolors=colors[y], facecolors='none')
                ax[n].legend(['Iteration '+str(n+1)],frameon=False, scatterpoints=0)
                ax[n].scatter(Mu[:,0], Mu[:,1], c='k')
                Mu = np.array([np.mean(X[y==k],axis=0) for k in range(K)])
              loss = np.linalg.norm(X - Mu[np.argmin(D,axis=1),:])**2/X.shape[0]
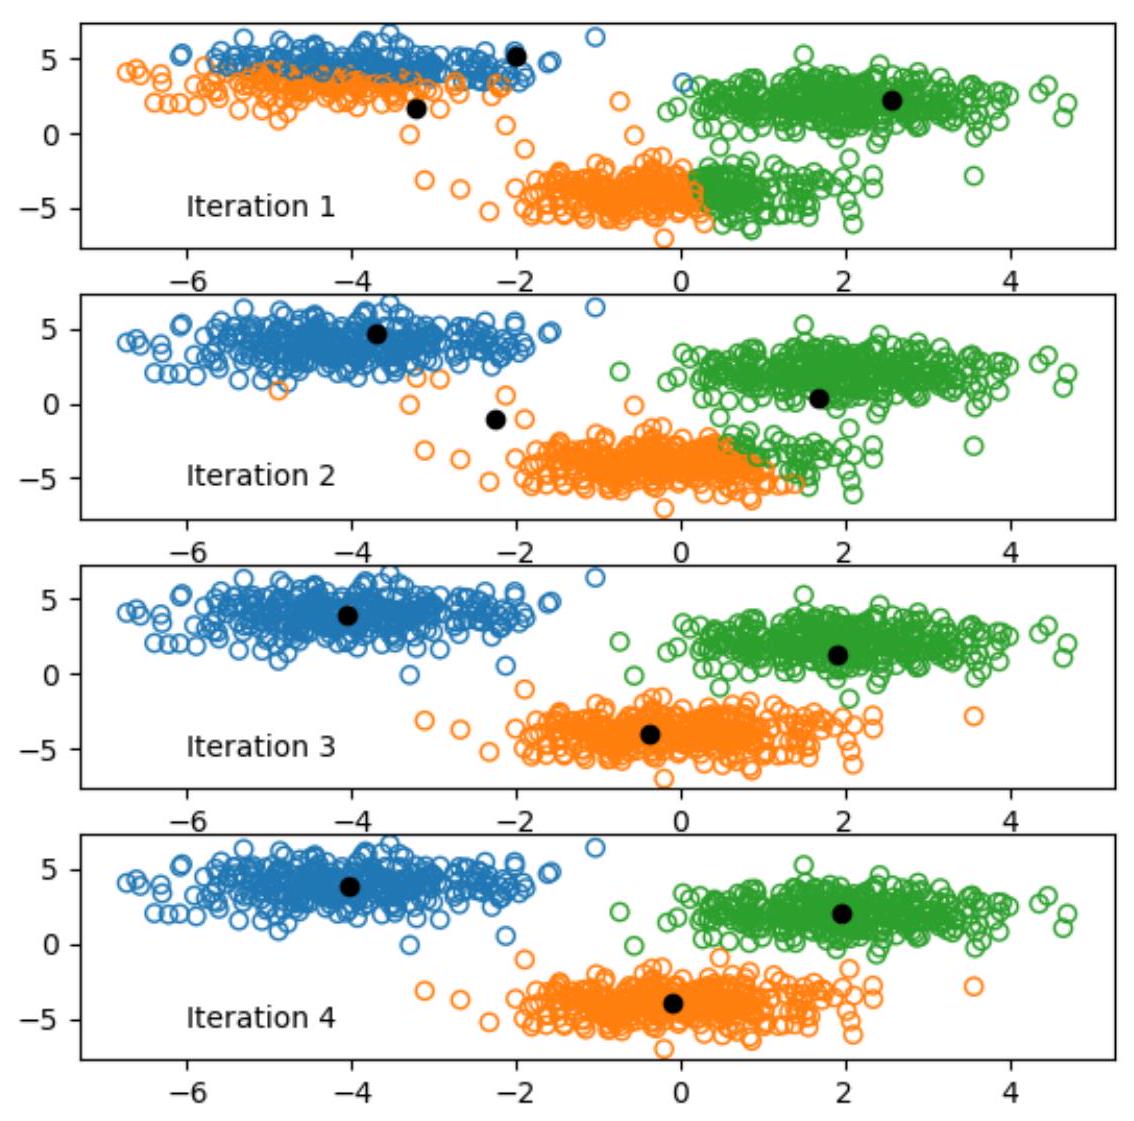
              
Fig. 11.1 shows the first four iterations of the algorithm. As can be seen, the iterative process is already converged.
Figure 11.1: Example of clustering process using K-Means


Enjoy and Build the AI World

Sample Code from AI Engineering

Cite the code in your publications

Linear Models